SiteVitals · June 2026
On 27 March 2026, Google released its March 2026 core update, completing its rollout on 8 April. It was widely reported as one of the most volatile updates on record, with significant ranking shifts across industries. Among the changes analysts identified was a move to composite Core Web Vitals scoring — where LCP, INP, and CLS now feed into a single performance signal rather than being assessed independently.
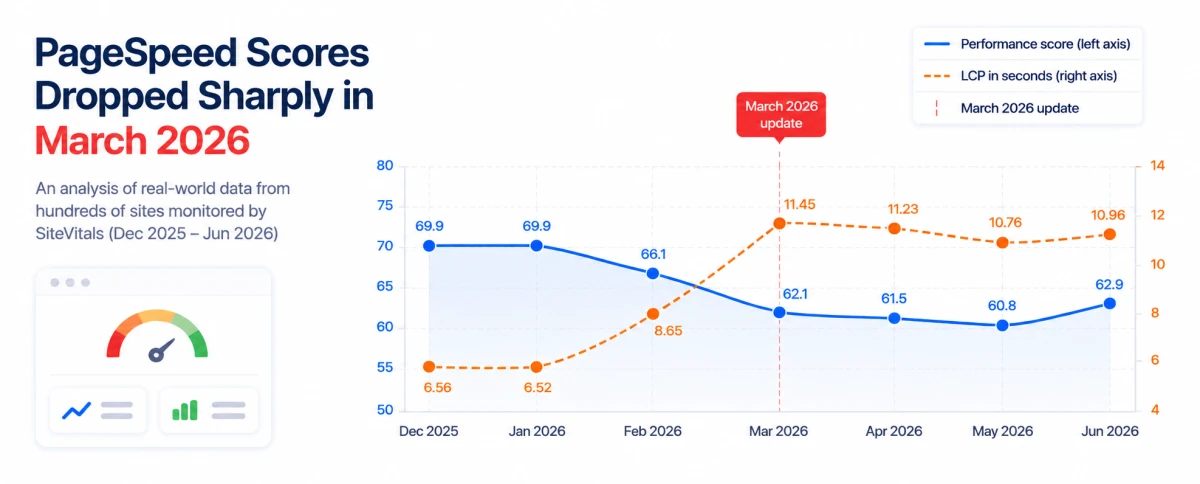
We set out to quantify the update's effect on PageSpeed Insights scores, using monitoring data collected by SiteVitals across hundreds of real-world sites. What follows covers December 2025 through June 2026, tracking performance scores and the underlying metrics that feed into them.
The headline finding
The update had a clear and measurable effect on scores. The average performance score across our monitored cohort fell from 68.1 before March 2026 to 61.7 after — a drop of 6.4 points across the same set of sites. The individual metrics beneath that headline reveal where the impact was actually felt.
Performance score
68.1 → 61.7
−6.4 points
LCP
7.71s → 11.31s
+68% in one month
Total Blocking Time
242ms → 394ms
+63% increase
The full metric breakdown shows a clear pattern — the impact is concentrated in rendering, not infrastructure:
| Metric | Before March 2026 | After March 2026 | Change |
|---|---|---|---|
| Performance score | 68.1 | 61.7 | −6.4 |
| LCP Largest Contentful Paint | 7.71s | 11.31s | +3.60s |
| FCP First Contentful Paint | 3.97s | 4.33s | +0.36s |
| TBT Total Blocking Time | 242ms | 394ms | +152ms |
| TTFB Time to First Byte | 44ms | 36ms | −8ms |
| CLS Cumulative Layout Shift | 0.067 | 0.032 | −0.035 |
Notably, two metrics — TTFB and CLS — actually improved after March. Server response times got faster and layout stability improved. The impact is concentrated entirely in rendering metrics: LCP, FCP, and Total Blocking Time. The update appears to have changed how browsers are asked to render pages in Google's lab environment — not how servers deliver them.
How sharp was the drop?
Looking at the monthly trend confirms the update had an immediate, concentrated effect rather than representing a gradual decline.
Performance scores held steady at 69.9 through December 2025 and January 2026, before dropping to 62.1 in March — a fall of nearly 8 points coinciding precisely with the update's rollout window. LCP tells an even starker story: it rose from 6.79 seconds in January to 11.45 seconds in March, a 68% increase on the same group of sites in a single month.
This is not a pattern consistent with sites gradually getting slower. The timing is too precise. The drop lands exactly where the update does.
The slight recovery visible in June may indicate early adaptation by site owners, though June represents only a partial month of data.
How sites moved between Google's scoring bands
Google defines three performance bands: Good (90–100), Needs Improvement (50–89), and Poor (0–49). Looking at how the distribution shifted across these bands after the update tells a more human story than averages alone.
Good scores (90–100)
18.2% → 8.7%
Cut roughly in half
Poor scores (0–49)
14.9% → 25.1%
Nearly doubled
The middle band — Needs Improvement — barely moved, shifting less than one percentage point. The update did not push sites gently down a notch. It specifically collapsed the top band and swelled the bottom, while leaving the middle largely untouched. This pattern is consistent with what analysts have described as a recalibration of the thresholds Google uses to define what "good" performance looks like — particularly relevant if Core Web Vitals are now being evaluated as a composite rather than independently.
Sites that were hit hardest
Some of the most significant drops came from sites that had previously been performing well — which is itself a telling detail:
Drop
−30
One site fell from an average score of 94 to 64 — previously solidly in the Good band, now Needs Improvement.
Drop
−14
Two sites that previously achieved a perfect score of 100 dropped to 86 and 90 respectively — pushed below Google's own Good threshold.
Total
13%
Of all monitored sites dropped more than 5 points after March — with losses concentrated among previously high-performing sites.
A site that scores 100 does not become 10–14 points worse because it got slower. The update raised the bar — and even previously excellent sites weren't exempt. If a single weak metric now drags a composite score down, sites that were previously passing on two out of three signals are now being measured differently.
What the update appears to have changed
Our data shows the impact was real, measurable, and concentrated in rendering metrics while server-side performance held steady or improved. Based on the data and wider analysis of the update, two factors appear to be in play — though it is worth being clear that this is our reading of the evidence, not a statement of confirmed fact:
Factor A
Composite Core Web Vitals scoring
Analysis of the March 2026 update suggests Google moved from assessing LCP, INP, and CLS as independent pass/fail signals to a single composite score. Under this model, one weak metric pulls the whole score down — even if the other two are clean. For sites that were borderline on LCP specifically, this change alone could account for a significant drop.
Factor B
Recalibrated scoring thresholds
Our data hints that the thresholds Google's Lighthouse-powered PageSpeed Insights uses to classify scores into bands may also have shifted — with the red/orange boundaries moving in ways that pushed more sites into Poor or Needs Improvement even without underlying performance changes. The collapse of the Good band from 18% to 9% of checks is consistent with this.
The improvement in CLS and TTFB across the same period is worth emphasising. Servers got faster, layouts got more stable. Whatever changed, site owners were not broadly neglecting their sites — the challenge introduced by this update is specific to rendering performance, which is harder to control, particularly for sites running CMSs, third-party scripts, or meaningful amounts of JavaScript.
Performance has always mattered for SEO. The March 2026 update appears to have made it matter more — and measure it differently. If your PageSpeed score dropped in March and nothing changed on your site, you are almost certainly not alone.
Methodology
Data was drawn from SiteVitals' automated PageSpeed Insights monitoring infrastructure, which runs checks against customer sites at regular intervals and stores results for trend analysis. For this study we identified sites with continuous monitoring records spanning both the pre-March period (December 2025 – February 2026) and the post-March period (March – June 2026), ensuring only like-for-like comparisons were made. Sites without records in both windows were excluded. In total 25,890 checks were included across 265 sites: 3,603 before March and 22,287 after. All scores and metrics are averaged across all checks within each period.

By Tom Freeman · Co-Founder & Lead Developer
Full-stack developer specialising in high-performance web applications and automated monitoring.