Server Monitoring
Know what's happening inside your servers — not just whether your site is up.
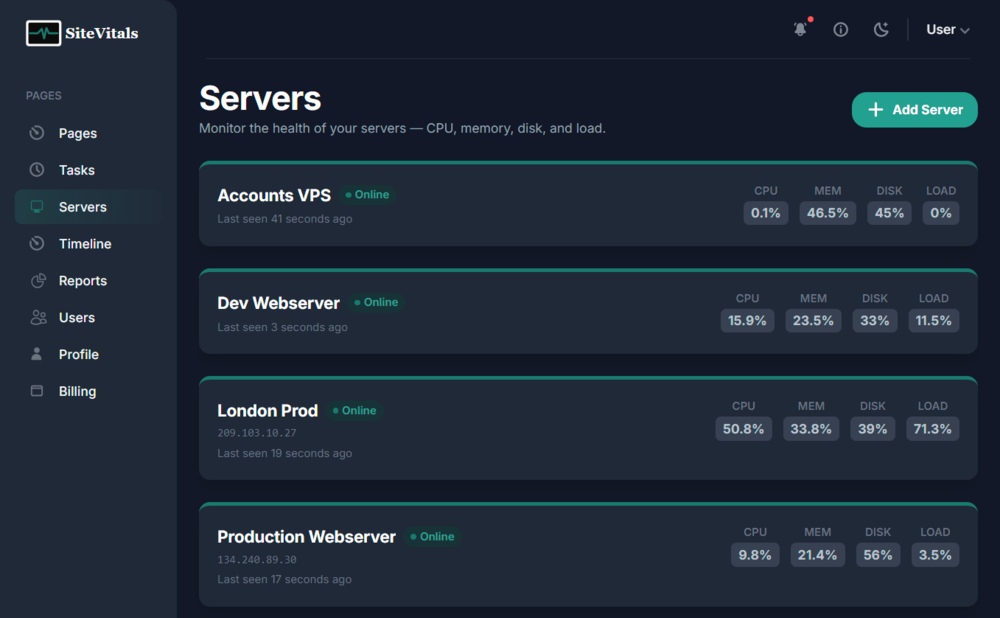
SiteVitals Server Monitoring gives you real-time visibility into the health of your Linux servers. CPU load, memory pressure, disk usage, load average, and running processes — all collected every minute and surfaced in a clean dashboard with alerting built in.
Uptime monitoring tells you when your site goes down. Server monitoring tells you why — and warns you before it happens.
How it works
You install a lightweight agent script on your server in under a minute. The agent collects system metrics every 60 seconds and pushes them to SiteVitals via a secure HTTPS API call. No open ports, no inbound firewall changes, no persistent daemon — the script runs, reports, and exits.
SiteVitals evaluates each check against your configured thresholds. When a metric breaches the warning or critical level and stays there for the configured duration, your alert channels fire — with escalation support so the right people get notified at the right time.
A server can be linked to one or more of your monitored sites, so server incidents appear on those sites' event timelines and alerts include which sites may be affected.
What gets monitored
Key features
- › One server, multiple sites — Link a single server to all the sites it hosts. Server incidents automatically appear on those sites' event timelines.
- › Configurable thresholds — Set your own warning and critical percentages per metric. Defaults are sensible out of the box — adjust when you know your server's normal behaviour.
- › Sustained breach detection — CPU and memory alerts only fire after a configurable sustained period (default: 5 minutes), preventing noise from momentary spikes.
- › Escalation channels — Configure multiple alert channels per server with different delays — notify the on-call developer after 5 minutes, the manager after 30.
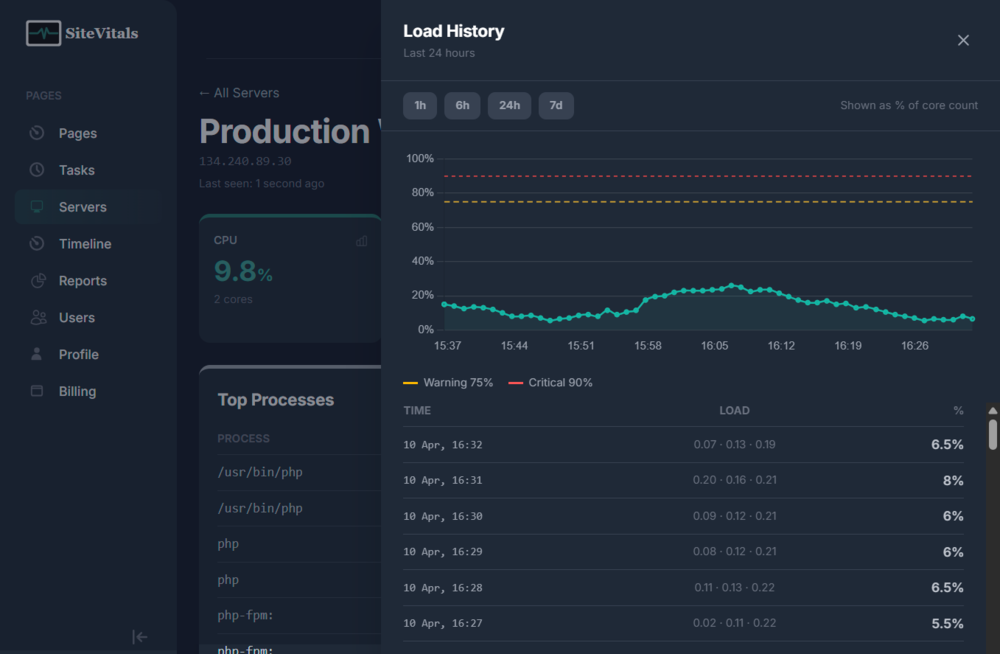
- › 24-hour history charts — Click any metric card on the dashboard to see a Chart.js history view with 1h, 6h, 24h and 7-day ranges.
- › Systemd and cron support — The installer auto-detects whether your server uses systemd timers or traditional cron and configures the appropriate scheduler.
- › No open ports required — The agent pushes data outbound over HTTPS. You don't need to open any firewall ports or allow inbound connections.
- › Low overhead — The agent consumes under 0.3% CPU per run and approximately 1.5 MB of network traffic per day. It exits completely between runs.
Common questions
Can I monitor disk space on my EC2 instance?
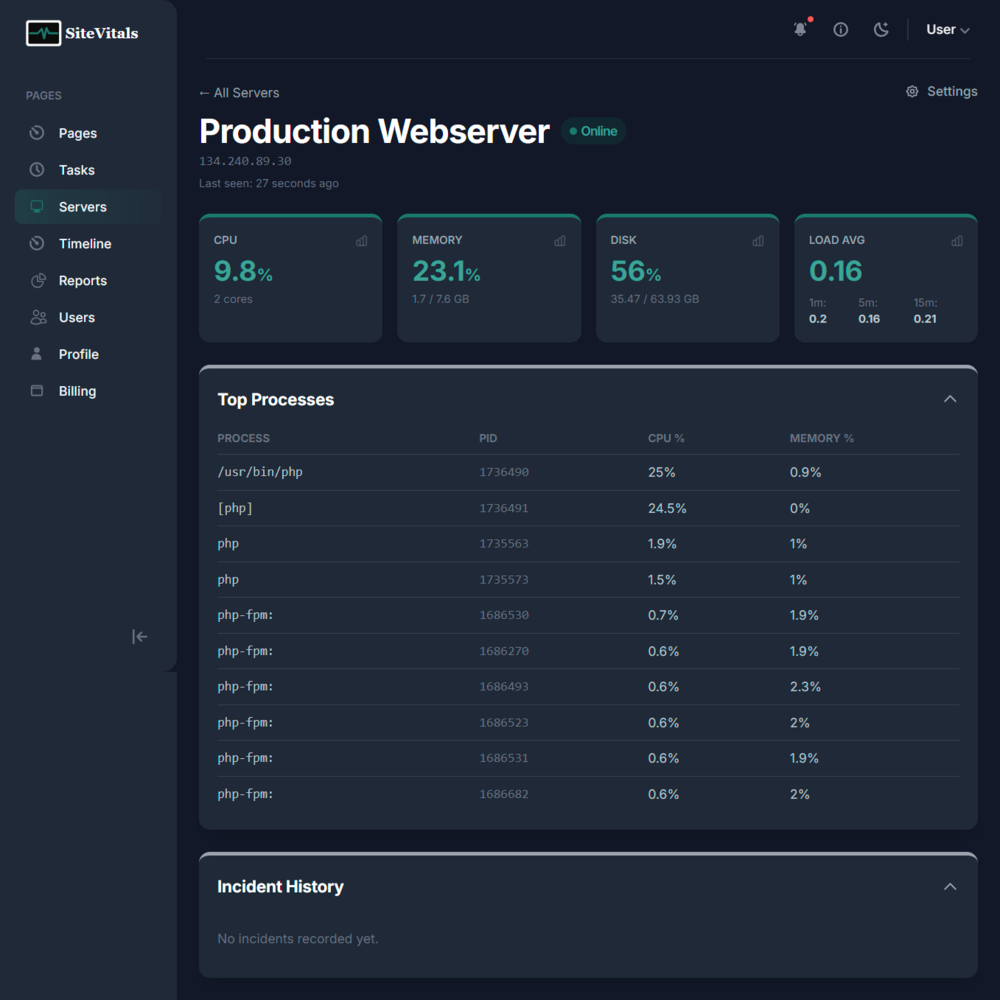
Yes. The agent monitors the primary root mount (/) and reports used and total GB alongside the percentage. Disk alerts fire immediately when the threshold is breached — there's no delay, since disk space doesn't recover on its own.
How do I set up CPU and memory alerts on my VPS?
Install the agent using the one-line command from your server's settings page, then configure your alert channels and thresholds from the Server Settings page. Default thresholds (warning at 75%, critical at 90%) work well for most servers. Alerts fire after 5 minutes of sustained breach to avoid noise from short spikes.
Which Linux distributions are supported?
The agent is a plain bash script with no dependencies beyond standard Linux tools. It has been tested on Ubuntu 20.04 and 24.04, Debian 10 and 12, Amazon Linux 2, CentOS 7, and AlmaLinux 8. Any modern Linux distribution should work.
Can I see which processes are consuming the most CPU?
Yes. Every check captures the top 10 processes by CPU usage, including their name, PID, CPU percentage and memory percentage. These are visible in the Process List section on your server dashboard.
What happens if my server goes offline completely?
If the agent stops reporting for more than 10 minutes, SiteVitals opens an "offline" incident and triggers your alert channels. When the server comes back online and the agent resumes reporting, a recovery notification is sent to all channels that received the offline alert.
How is load average shown — what does a percentage mean?
Load average is normalised as a percentage of available CPU cores. A load_5 of 1.0 on a single-core server equals 100% — meaning the core is fully utilised. On a 4-core server, a load_5 of 4.0 also equals 100%. This makes thresholds consistent regardless of server size.
Get started in under a minute
Add your server and run the one-line installer. Your first metrics will appear within 60 seconds.