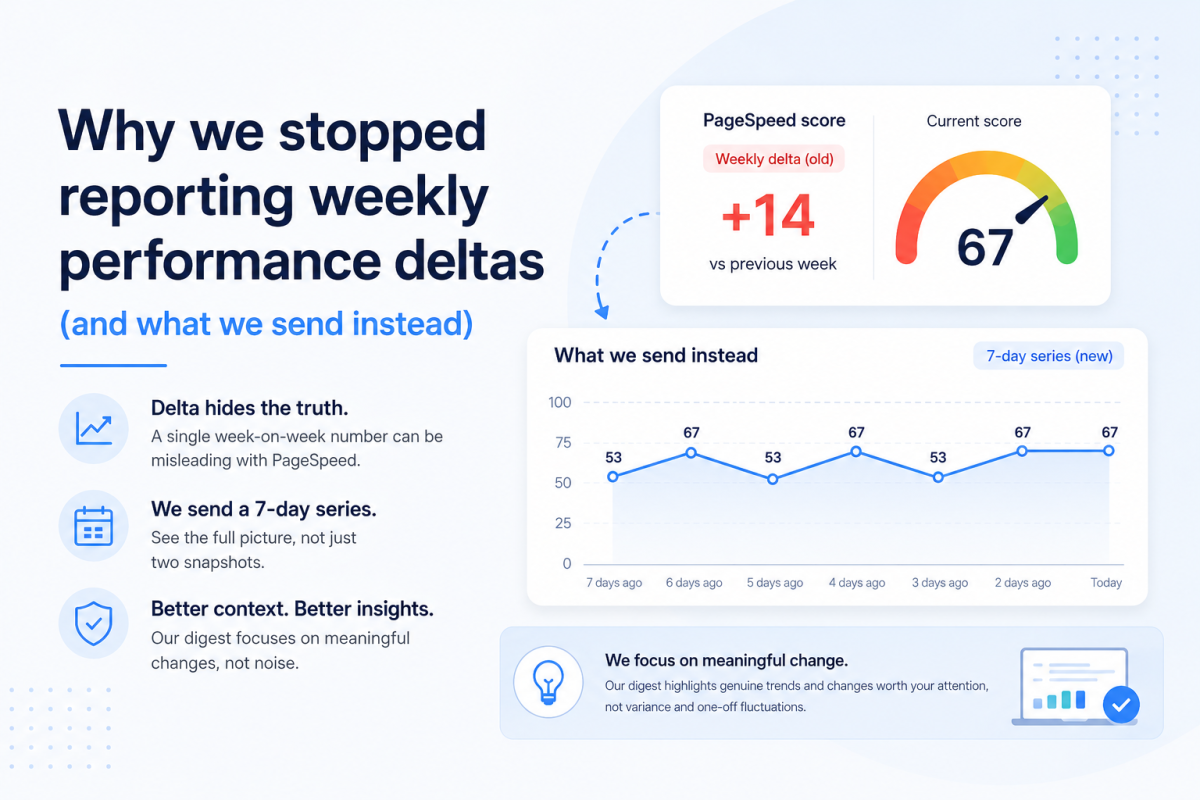
Last week we wrote about why we stopped reporting weekly performance deltas . A single week-on-week number was hiding what actually happened in between, so we replaced it with a 7-day score series and let the digest reason over the full week instead of two snapshots.
That was a step in the right direction, but not the whole answer, and it turned out to still be too reliant on the model's own reading of the numbers. We looked at just handing over more history, a full 30 days instead of 7, but the payload got too large to be practical. So rather than more raw data, we built a proper pre-examination of it instead: a summary the model could read accurately, rather than infer from.
The series didn't stop the endpoint problem, it just moved it
This week's digest flagged a client site as the biggest decline in the portfolio. The line read something like: PageSpeed had dropped from 49 to 42, a 7 point fall over the week. Specific, sourced from real numbers, and wrong in the way that matters.
The series behind that sentence was [49, 50, 46, 45, 38, 51, 42]. Up, then up again, then down for three days running, then up, then down. Read the whole week rather than just the first and last figures and there's no consistent direction in there, just a score moving around inside its normal range. We checked the site's broader history out of curiosity and found the same pattern going back months: scores moving within a fairly wide band, no sustained trend in either direction.
We gave the model seven days of context precisely so it could tell a real decline from a noisy week. What we hadn't accounted for was a model that, even with the full spread sitting right there, still reached for the same shortcut it used with a single delta: take the first value, take the last, subtract one from the other, and call the difference a trend. Sending more data narrowed the odds of that happening. It didn't remove them.
Stop asking the model to spot a trend, tell it the trend
The actual fix isn't a longer series or a firmer instruction. It's not asking the model to do the statistics at all. We now compute a trend server-side, using every point in the window rather than the two ends of it, and hand the digest a verdict instead of a puzzle:
"speed": {
  "current": 42,
  "trend": "stable",
  "slope_per_day": -0.96,
  "days_covered": 7,
  "scores": [49, 50, 46, 45, 38, 51, 42]
}
trend is fitted across the whole window, not the endpoints, and it's only ever allowed to say declining or improving when the movement is clearly larger than the site's normal day-to-day noise. Here, despite the week ending seven points lower than it started, the movement doesn't clear that bar, so it comes back stable, which is the honest read. On weeks where monitoring itself has gaps, fewer than five of the last seven days checked, the field says so directly as insufficient_data rather than presenting a partial week as if it were a full one.
The prompt now trusts that field instead of re-deriving one from the raw scores. It also has to sit alongside a second rule: an area can be sitting in critical territory on score alone while its trend is stable. That's not new bad news, it's old bad news that's still there. The digest now says so plainly rather than dressing a chronic issue up as this week's regression.
The bar for "critical" was also wrong for performance specifically
Separately, we noticed the site in question was being marked critical on performance at a score of 42, using the same below-50 threshold we apply to SEO, security, and integrity. PageSpeed doesn't behave like those areas. Plenty of ordinary, working sites sit in the 40s permanently, for reasons that have nothing to do with something being broken. A threshold built for scores that are usually in the 70s and 80s was firing every week on sites that had simply always scored lower, and a label that fires constantly stops meaning anything by the third week. Performance now uses its own critical threshold, set lower, at 30. The other three areas are untouched.
Same lesson, one layer deeper
Last week's conclusion was that the fix is rarely a better prompt, it's better data. That's still true, as far as it goes. But it turns out "better data" isn't just a question of volume. Handing over more numbers and trusting the model to read them correctly is still asking it to do a job it isn't reliably good at. Seven days of scores is better than two, but a language model reading a noisy series has no way to know whether it's looking at genuine movement or ordinary variance, unless something tells it. So now something does.
We'd rather ship a digest that says "not enough data to call this a trend" than one that's confidently specific and wrong. That's a duller sentence to read, but it's the one that's actually true, and it's the one we'd want to receive about our own sites.

By Tom Freeman · Co-Founder & Lead Developer
Full-stack developer specialising in high-performance web applications and automated monitoring.
Share this post
Stay in the loop
Get new posts delivered to your inbox. No spam, unsubscribe any time.