PageSpeed scores are inherently variable. Run Lighthouse on the same unchanged page twice and you will often see a difference of 5 to 15 points. Run it every day for a week and the scores can swing dramatically without a single line of code changing. Google's own documentation on Lighthouse variability is clear about this: network conditions, server load, third-party script response times, and browser execution timing all affect the result. Any individual Lighthouse run is a noisy measurement.
This creates a problem for automated reporting. If you take a performance snapshot on Monday, take another the following Monday, subtract one from the other, and report the difference as a weekly trend, you are comparing two noisy readings. The result may tell a story that has nothing to do with what actually happened to the site.
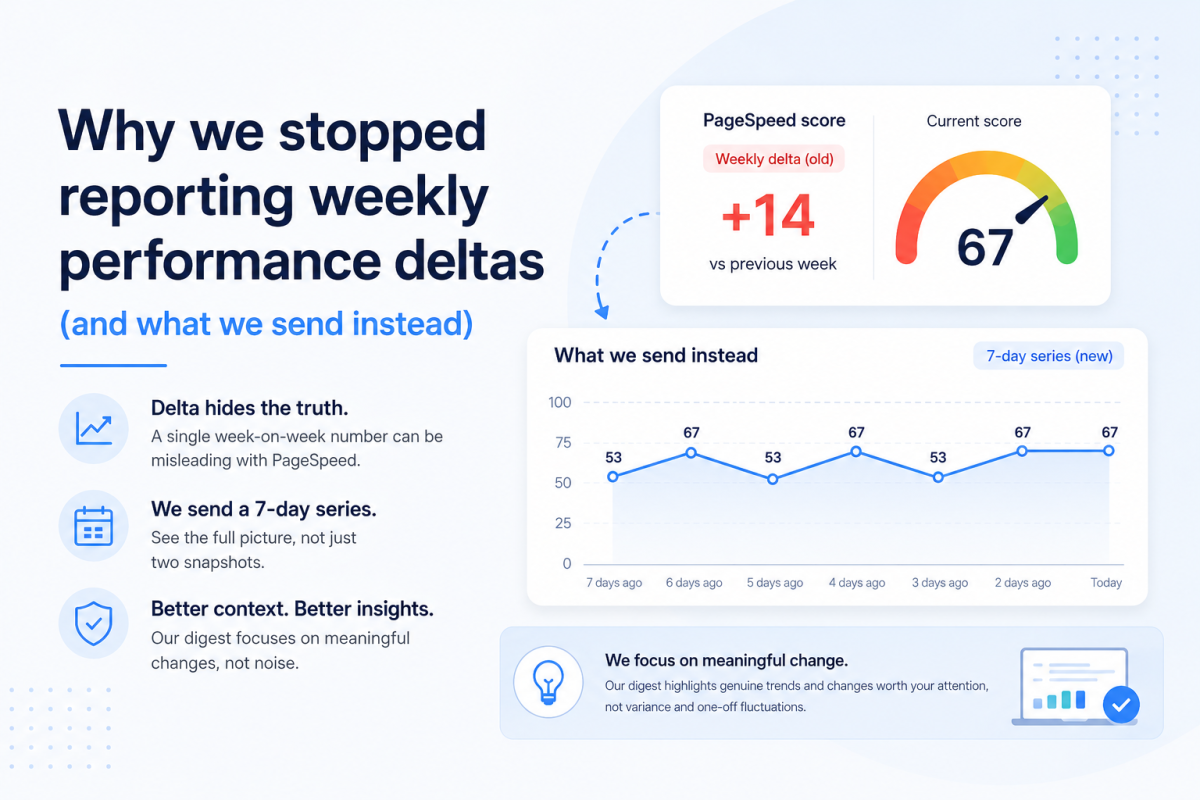
This morning our weekly digest did exactly this. It reported a 14-point PageSpeed improvement on a client site. The score had been bouncing between 53 and 67 all week — the client had changed nothing — and a coincidence at the week boundary made it look like progress. The AI reported exactly what the data said. The data was wrong.
What a delta hides
A delta like +14 is the result of two numbers: the score at the start of the window and the score at the end. Everything in between is invisible.
Consider two sites, both showing a +14 delta this week:
- Site A: scores of 53, 67, 53, 67, 53, 67, 67. Oscillating between two states all week, no meaningful change.
- Site B: scores of 53, 55, 58, 61, 63, 65, 67. A genuine, consistent upward trend across the full week.
A delta treats these identically. One deserves a mention in a client digest. The other does not. Without seeing the scores that produced the number, you cannot tell which is which.
The inverse is just as misleading. A site scoring 67, 67, 67, 67, 67, 67, 53 has a delta_week of -14, which looks like a significant decline. But the score was completely stable for six days and only dropped on the final reading. Reporting that as a week-on-week regression would send someone investigating a problem that may simply have been a bad Lighthouse run.
A week-on-week delta does not distinguish between variance and movement. For performance scores, that distinction is the entire point.
What we changed
We replaced the delta fields in the SiteVitals digest payload with a 7-day score series. Each area now sends a scores array containing one reading per day, oldest to newest, alongside the current value. For the site that prompted this change, the payload now looks like this:
"speed": {
  "current": 67,
  "scores": [53, 67, 53, 67, 53, 67, 67]
}
Any reasonably capable model can look at that series and conclude there is no meaningful trend. It cannot reach that conclusion from delta_week: 14 alone.
The digest prompt now instructs the model to treat a genuine decline as a series moving consistently downward across several days, not a single dip. A score that drops on one day and recovers the next is variance. A score that drops on Monday and keeps dropping through Friday is a regression worth raising with a client.
The same series approach works well for event-driven scores like SEO, security, and integrity, where scores tend to stay flat for days and then jump when something changes. A security score that has been 52 for seven consecutive days is a chronic issue, not a regression. A security score that was 78 on Monday and 52 by Wednesday is a regression. The series makes that difference visible. A delta, depending on which two days you happened to sample, might not.
The broader point
If you are building automated reporting on top of monitoring or analytics data, the reliability of what gets written depends almost entirely on what you put in. A language model is good at synthesis and narrative. It is not good at auditing whether the numbers it has been given are trustworthy. Feed it a misleading delta and it will report that delta confidently.
The fix is rarely a better prompt. It is better data. Give the model enough context to reason correctly rather than trying to compensate for a thin or ambiguous input with more instructions.
Replacing two snapshot values with seven days of readings is a small change to the payload. The improvement in output reliability was immediate.

By Tom Freeman · Co-Founder & Lead Developer
Full-stack developer specialising in high-performance web applications and automated monitoring.
Share this post
Stay in the loop
Get new posts delivered to your inbox. No spam, unsubscribe any time.