Your site goes down at 2am. You get the uptime alert and SSH in to investigate. The site is returning 502s. Is it nginx? PHP-FPM? The database? You start checking logs, running top, looking at disk usage — detective work you're doing in the dark, with users already affected.
What if you'd known an hour earlier that CPU had been climbing steadily since midnight? That disk was at 94%? That a rogue process had been pegging a core since the last deployment?
That's the difference between knowing your site is down and knowing why. Today we're shipping the feature that bridges that gap: Server Monitoring is now live in SiteVitals.
What server monitoring gives you
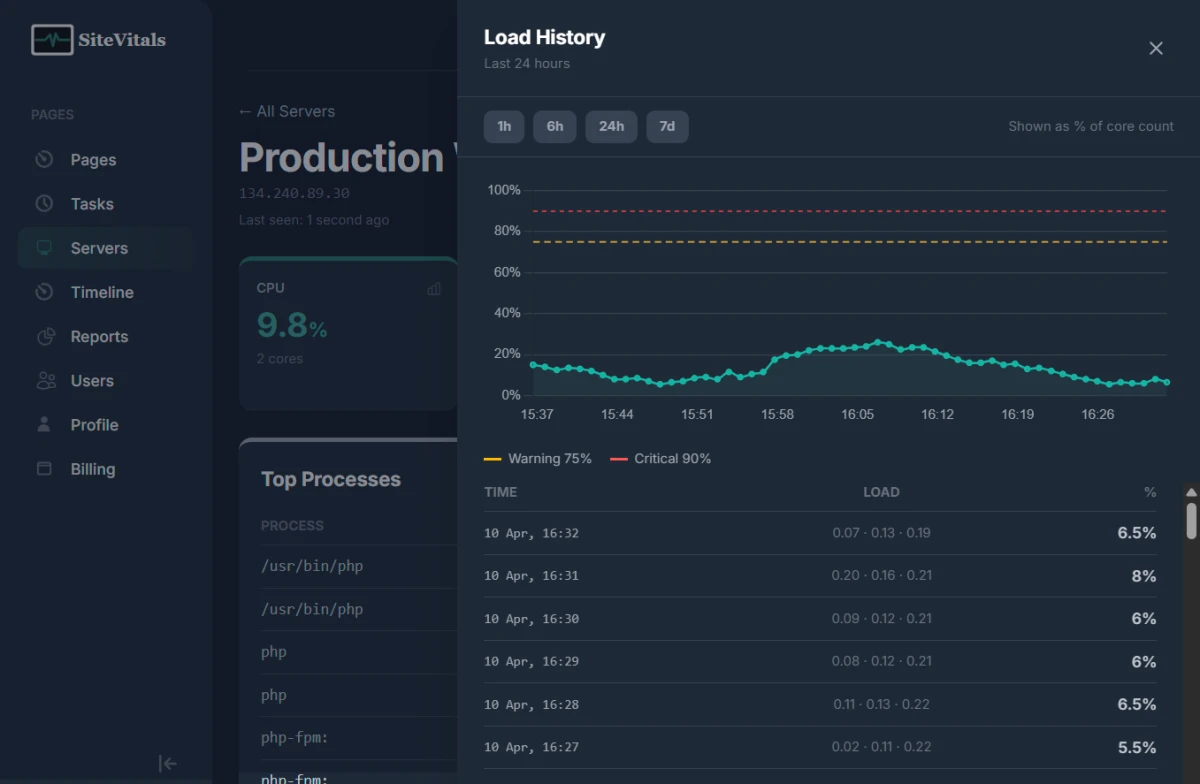
SiteVitals uptime monitoring has always watched your site from the outside — checking whether it responds, how fast, with what status code. Server monitoring watches from the inside. Every 60 seconds, a lightweight agent script collects four key metrics and pushes them to your SiteVitals dashboard:
- CPU usage — average utilisation across all cores
- Memory usage — used RAM as a percentage and in GB, with swap tracked separately
- Disk usage — primary mount usage as a percentage and in GB
- Load average — 1, 5 and 15-minute averages, normalised as a percentage of your core count so thresholds work consistently across server sizes
And alongside those four metrics, every check captures the top 10 processes by CPU usage. So when you get a CPU alert at 3am and open the dashboard, you can see exactly what was running — not just that the CPU was high.
How the agent works
There's no daemon to manage. No persistent background process. No open firewall ports. The agent is a bash script that runs once per minute, collects your metrics, makes a single HTTPS POST to the SiteVitals API, and exits completely. On a typical Linux VPS, each run consumes under 0.3% CPU and the total network overhead is around 1.5 MB per day.
Installation is a one-line command. Add a server from the SiteVitals dashboard, copy the personalised install command, run it on your server as root, and your first metrics appear within 60 seconds:
curl -sSL https://www.sitevitals.co.uk/agent/install.sh | sudo bash -s -- --key YOUR_API_KEYThe installer detects whether your server uses systemd or traditional cron and configures the appropriate scheduler automatically. It works on Ubuntu, Debian, Amazon Linux, CentOS, AlmaLinux, and any modern Linux distribution with standard shell tools available.
Alerting: the same escalation model you know
Server monitoring uses the same per-channel escalation system we shipped for uptime alerts. Each server has its own alert channels, each channel has its own delay, and SiteVitals handles the rest.
When a metric breaches its threshold and stays there for the configured duration, an incident opens and the clock starts. A channel with no delay fires immediately. A channel with a 30-minute delay stays quiet unless the incident is still active after half an hour. If the metric recovers before a channel's threshold is reached, that channel never fires at all.
A practical escalation setup for a production server:
| Delay | Channel | Who gets it |
|---|---|---|
| 0 minutes | In-app | Everyone on the team |
| 5 minutes | On-call developer | |
| 30 minutes | Engineering manager | |
| 60 minutes | Webhook → PagerDuty | CTO on-call phone |
CPU and memory alerts require a sustained breach — by default, 5 minutes — before an incident opens. This filters out the momentary spikes that happen during deployments, cron jobs, and scheduled tasks without any false alarms. Disk alerts fire immediately: a full disk doesn't resolve itself.
Thresholds: sensible defaults, fully configurable
Default thresholds are applied when you add a server:
| Metric | Warning | Critical |
|---|---|---|
| CPU | 75% | 90% |
| Memory | 75% | 90% |
| Disk | 80% | 95% |
| Load Average | 75% of core count | 90% of core count |
These work well for most general-purpose servers. If your server routinely runs hot during batch processing or you're running a high-traffic database where 85% memory utilisation is completely normal, you can adjust them per metric from Server Settings. There's a reset to defaults option if you want to start fresh after experimenting.
Linked to your sites
A server can be linked to one or more of your monitored pages. When a server incident opens — whether it's a sustained CPU spike, disk running low, or the agent going offline — that event appears on the linked sites' event timeline alongside uptime events, SEO changes, and security updates. Alert emails include a list of the hosted sites that may be affected.
This closes the loop between "something is wrong with the server" and "here's which sites that puts at risk" — useful for agencies managing infrastructure for multiple clients on shared hosting.
Questions we've been asked
Can I monitor disk space on my AWS EC2 instance?
Yes. CloudWatch monitors EC2 CPU and network by default but requires the CloudWatch Agent for memory and disk — and that agent is considerably heavier than ours. The SiteVitals agent installs in one command, needs no IAM roles or CloudWatch configuration, and reports disk usage (including used and total GB) alongside CPU, memory, and load average. It works on EC2 regardless of AMI, region, or instance type.
Does this work on DigitalOcean Droplets?
Yes. DigitalOcean's built-in monitoring covers similar metrics but keeps them inside the DigitalOcean control panel, separate from your site monitoring. The SiteVitals agent gives you unified visibility — server metrics, uptime, SEO, security, and performance — in one place, with your own alerting and escalation rules rather than DigitalOcean's notification system.
What about Linode, Hetzner, or on-premise servers?
Any Linux server you can SSH into works. The agent doesn't care who hosts it. We've tested on Ubuntu 20.04 and 24.04, Debian 10 and 12, Amazon Linux 2, CentOS 7, and AlmaLinux 8. If it runs bash and has curl installed, the agent will run.
Will it work with a UK-based VPS?
Yes. The agent makes outbound HTTPS calls to the SiteVitals API — no inbound connections are required, so UK data centre firewalls that restrict inbound traffic work fine. The API endpoint is hosted in the UK and data is processed and stored in the EU. If you have questions about data residency for compliance purposes, get in touch.
Can I set up process monitoring and alerts on Linux?
The process list captured with every check shows you the top 10 processes by CPU usage at the time of each measurement. This isn't real-time process monitoring with per-process alerts — it's forensic context. When a CPU alert fires, you can click into the history panel, look at the checks from when the breach started, and see exactly what was running. This answers "what caused it" without requiring a separate process monitoring tool.
How does load average alerting work on multi-core servers?
Load average is normalised by CPU core count. A 5-minute load average of 1.8 on a 2-core server equals 90% — critical. The same load average of 1.8 on an 8-core server equals 22.5% — completely healthy. Your thresholds stay consistent regardless of server size, so you don't need to maintain separate threshold configs for differently-sized infrastructure.
What happens if the server goes offline completely?
If the agent stops reporting for more than 10 minutes — whether the server is genuinely down, the agent has been removed, or network connectivity is lost — SiteVitals opens an offline incident and alerts your channels. When the agent starts reporting again, a recovery notification goes to every channel that received the offline alert.
This is independent of your site's uptime monitoring. A server can be offline while the site is still being served from a CDN cache. You'll know about both situations separately, through the appropriate channels.
Available now
Server monitoring is available now. The number of servers you can monitor depends on your plan — check the pricing page for limits. Alert channels per server follow the same model as site alert channels.
If you're already a SiteVitals user, head to Servers in the sidebar to add your first server. The full setup — adding the server, running the installer, and seeing live metrics — takes under two minutes.
If you're not using SiteVitals yet, sign up free and you'll have both uptime and server monitoring running in under five minutes.
The documentation — including the quick start guide, alert configuration reference, and troubleshooting guide — is available at sitevitals.co.uk/docs/server-monitoring.

By Tom Freeman · Co-Founder & Lead Developer
Full-stack developer specialising in high-performance web applications and automated monitoring.