Yesterday we shipped server monitoring — CPU, memory, disk, and load average for your Linux servers, collected every minute by a lightweight agent. Today we're shipping the follow-up feature that we think is equally valuable: service monitoring.
Server metrics tell you the server is under strain. Service monitoring tells you which piece of software caused it.
What service monitoring does
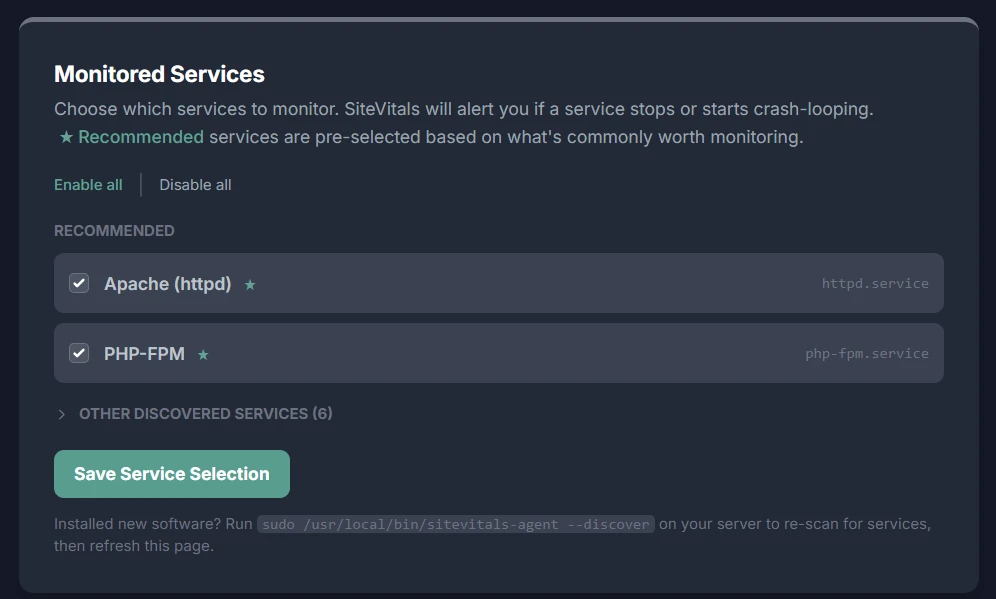
Once the agent is installed, it scans your server for running systemd services and sends the list to SiteVitals. You get a checklist in your server settings — known services like nginx, MySQL, Redis, and PHP-FPM are pre-ticked. You confirm the selection, and from that point on, every 60-second agent run checks the status of each monitored service.
When a service transitions from active to any other state — inactive, failed, dead — SiteVitals opens an incident immediately and triggers your configured alert channels. When the service recovers, the incident closes and a recovery notification goes to every channel that received the down alert. The same per-channel escalation delays you set up for resource metric alerts apply here too.
There's also crash-loop detection. If a service restarts two or more times between consecutive checks — meaning it's restarting faster than once a minute — SiteVitals opens a warning incident even though the service is currently showing as active. A service that's crash-looping will eventually hard-fail. The warning gives you time to investigate before that happens.
Context captured at failure time
One of the most frustrating things about a 3am service failure is that by the time you're SSHing in, the thing that caused it has often changed. The process that was pegging the CPU is gone. The memory pressure has eased because the service crashed and freed its allocation. You're debugging a ghost.
When SiteVitals opens a service incident, it snapshots the state of the server at that exact moment — CPU usage, memory usage, load average, the top 10 processes by CPU, and the status of every other monitored service. That snapshot is stored with the incident. If you open the server dashboard and look at the incident an hour after it happened, you can still see what was running when nginx stopped.
Crash-loop alert emails include the exact journalctl and systemctl status commands pre-filled with your service name:
journalctl -u nginx.service -n 50 --no-pager
systemctl status nginx.service
You can paste those directly into your terminal without having to remember the syntax at 3am.
Discovery: no manual configuration
We made a deliberate decision not to ask you to type service names during setup. Typing nginx instead of nginx.service, or mysql instead of mysqld on a CentOS server, would be a common source of errors. Instead the agent scans your server and tells SiteVitals what's actually running.
The discovery pass happens automatically when the agent installs. After that, you get a checklist — pre-ticked for commonly important services, collapsed for everything else. You tick what you want, save, and the agent picks up the new configuration within 60 seconds.
If you install new software after the initial setup, run a re-scan from your terminal:
sudo /usr/local/bin/sitevitals-agent --discoverThen refresh the Monitored Services page and the new service will appear in the list. Existing selections aren't touched.
What can be monitored
Any named systemd service can be monitored. The following are automatically recognised and pre-ticked during discovery: nginx, Apache, Caddy, MySQL, MariaDB, PostgreSQL, MongoDB, Redis, RabbitMQ, PHP-FPM (all versions), Supervisor, PM2, Gunicorn, Elasticsearch, OpenSearch, Postfix, Dovecot, Fail2ban, Varnish, and HAProxy.
Services not in that list are still discovered and available to monitor — they just aren't pre-ticked. If your application runs as a custom systemd service, it will appear in the "Other discovered services" section and can be enabled with a single click.
How this fits with the rest of your monitoring
Service incidents appear on the event timeline of any site linked to that server — the same Change Intelligence timeline that already shows uptime events, SEO changes, security regressions, and content modifications. If nginx went down at the same time as a spike in your uptime error rate, both events appear on the same timeline in the right order. Correlation becomes obvious.
Alert emails for service failures include a list of hosted sites that may be affected — useful for agencies managing shared infrastructure where a single server hosts multiple client sites.
Questions we've been asked
Can I monitor services on my AWS EC2 instance?
Yes. The agent works on any Linux server you can SSH into. EC2, DigitalOcean, Hetzner, Linode, on-premise bare metal — if it runs systemd and has curl installed, it works. The agent makes outbound HTTPS calls so no inbound firewall changes are needed.
Will a planned deployment restart trigger an alert?
A single clean restart won't trigger a crash-loop alert — the threshold is two or more restarts between consecutive 60-second checks. A normal deployment that restarts nginx once registers as one event and is ignored. The crash-loop detection is specifically for services that are failing to start cleanly and being restarted by systemd repeatedly in quick succession.
Does this work on non-systemd servers?
Currently service monitoring requires systemd. All modern Ubuntu, Debian, CentOS, AlmaLinux, and Amazon Linux installations use systemd, so this covers the vast majority of Linux servers in production. SysV init and OpenRC are not currently supported.
Can I monitor a custom application service?
Yes, as long as it's registered as a systemd service. If your Laravel queue worker runs as laravel-worker.service, or your Node application runs as myapp.service, it will appear in the discovery list and can be monitored exactly like nginx or MySQL.
How do I set up nginx monitoring on Ubuntu?
If the agent is already installed, run sudo sitevitals-agent --discover, then open Server Settings → Monitored Services in SiteVitals. nginx.service will appear pre-ticked. Save, and it's being monitored within 60 seconds. If you're installing the agent fresh, discovery runs automatically — you'll see the checklist in your server settings within a minute of installation completing.
What about Windows servers?
The agent is a bash script and requires Linux. Windows server support is not currently planned for the agent-based monitoring approach, though we're open to it as a future direction if there's demand.
Available now
Service monitoring is live now for all servers. If your agent is already installed, run the discovery command and configure your services from the settings page. If you're setting up a server for the first time, the quick start guide walks through the full process including service configuration.
The documentation for service monitoring — including the full list of pre-recognised services, re-scan instructions, and the crash-loop detection logic — is at sitevitals.co.uk/docs/server-monitoring/services.
If you're not using SiteVitals yet, sign up free and you'll have server and service monitoring running in under five minutes.

By Tom Freeman · Co-Founder & Lead Developer
Full-stack developer specialising in high-performance web applications and automated monitoring.