If you've ever run a page through Google's PageSpeed Insights, you'll know the feeling. You get a score, a row of coloured circles, a list of measurements with three-letter names and a long list of things that could be better. And unless you build websites for a living, it's really hard to tell which of those things matter and which ones you can leave alone.
The SiteVitals Performance report uses the same testing behind the scenes, but it's set up to answer the questions most people actually have. Is my site getting faster or slower? Is there anything worth fixing? And if there is, what do I tell whoever looks after my website? This article walks through the report in the order you'll see it, what each bit means and, just as importantly, why it's there.
Here's what's covered:
- Where the data comes from
- Why it says "mobile test"
- Your Performance score and history
- What needs attention
- Images you can improve now
- The key performance metrics
- Passing checks and developer details
- Trends, and what the report can and can't tell you
Where the data comes from
We're not making up our own speed score. The Performance report is built on Google's PageSpeed Insights and Lighthouse (Lighthouse is Google's free testing tool - it loads your page in a controlled environment and measures how it behaves). The score you see is Lighthouse's Performance score, shown out of 100.
What we add is everything around it. Lighthouse gives back a LOT of information, and we pick out the parts that matter most, turn the important findings into plain-English issues and keep every scan so you can see how things change over time. So the report is really three layers:
- the headline - your score, the key measurements and how they're trending
- the things worth acting on - a short, prioritised list rather than everything Lighthouse flagged
- the technical evidence - tucked away in Developer details for whoever needs to investigate
(The technical bit: each check asks Lighthouse for its Performance, Accessibility and Best Practices categories. This report focuses on performance, so you won't find a full accessibility audit here.)
Why it says "mobile test"
At the top of the report you'll see the page we're testing, whether monitoring is switched on, when the last scan ran, a Recheck button, a date picker for looking at older checks - and a label saying this is a mobile test.
That's deliberate. Most people visit most websites on their phones these days, and Google looks at the mobile version of your site first. Lighthouse's mobile test also simulates a mid-range phone on a slower connection, rather than a shiny new laptop on fast office wifi. So if your site feels fast when you open it at your desk but scores lower here, that's normal - the test is looking at it the way plenty of your visitors do.
Your Performance score and history
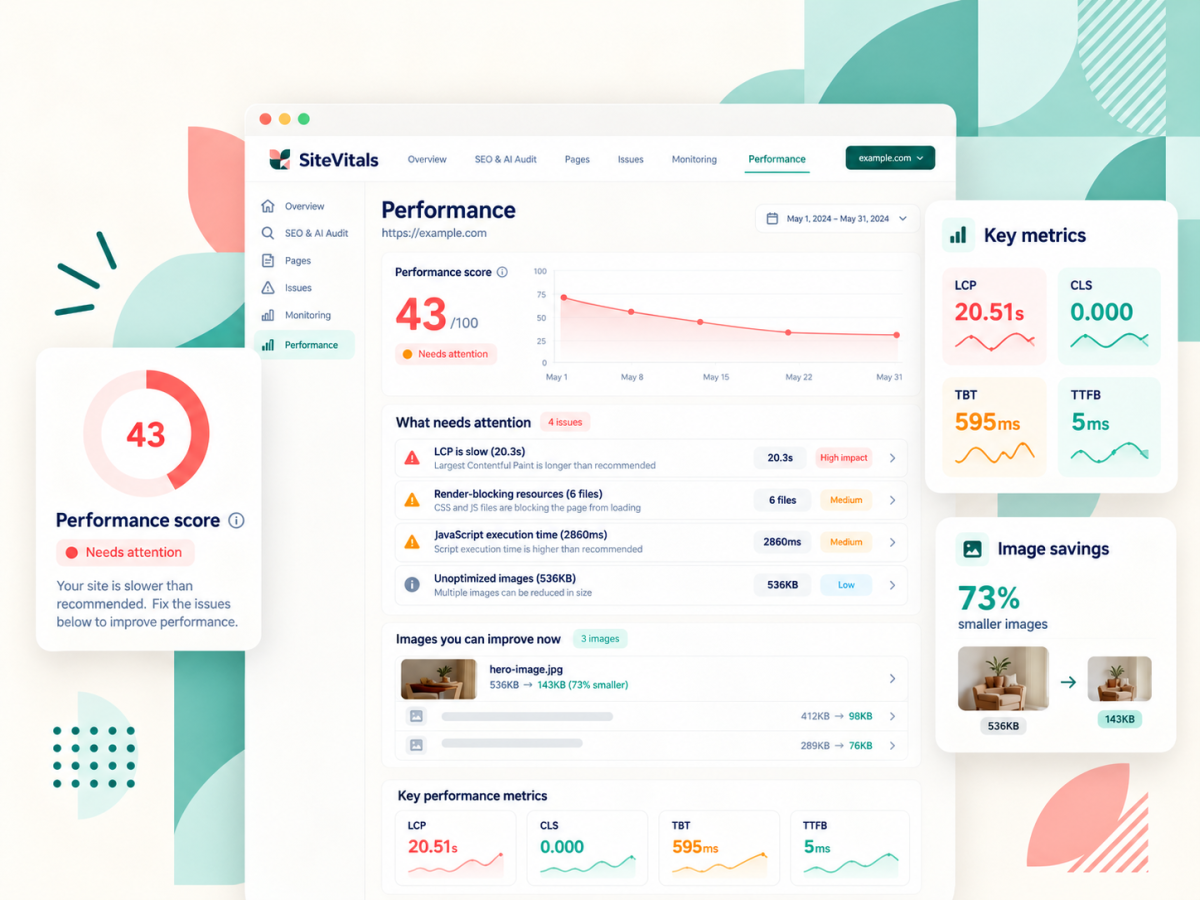
The main panel shows your current Performance score out of 100, with a simple status like "Needs improvement". Next to it is a graph of your recent checks (usually the last 30), so you can see whether things are getting better, worse or holding steady. You'll also see your current LCP and page weight (more on both below), how they've moved over roughly the last month, and sometimes a short note in plain English about the trend or the biggest issue right now.
The thing I'd really like you to take from this section is that the score is a health indicator, not a target. Getting to 100 isn't the point, and plenty of good, successful websites never do. What matters is whether the experience is good for your visitors and whether it's heading in the right direction.
(Should you worry if your score moves by a few points? No. Lighthouse results naturally wobble a bit from one test to the next, even when nothing on your site has changed. A drop of three points is usually noise. A steady slide over a few weeks is worth a look.)
What needs attention
Lighthouse runs dozens of checks on every page, and if we showed you every one of them, the important ones would get lost. So instead we pick out the findings that look most relevant and turn them into a short, prioritised list.
Each item has a plain title, the measurement or amount involved, a priority label (like High impact or Review), a short explanation of what's likely going on and more detailed evidence for anyone investigating. For example, you might see:
- "LCP is slow (5.93s)", with a note that render-blocking resources delayed the page from appearing
- "Uncached assets (~19KB)", explaining that some static files don't seem to be telling browsers to save a copy for next time
Those are just examples - what shows up depends entirely on what Lighthouse found on your page. And a note on that second one, because it's easy to misread. It doesn't mean your whole site has no caching (caching is when a browser or server keeps a copy of a file so it doesn't have to fetch it again). It means some individual files could be cached better.
Where a slow LCP is involved, we go a step further and look at which part of the loading process took longest. Was the page waiting for the server? Waiting to start downloading the main image or text? Taking ages to download it? Or had it downloaded but was waiting to draw it on screen? That's useful, because it stops everyone assuming every slow page is down to a big image (sometimes it is, often it isn't).
Images you can improve now
Rather than the usual vague "optimise your images", this section shows you specific images on the page that Lighthouse thinks could be smaller, with a summary of how many there are and the total estimated saving.
For each one, you may see a thumbnail, the file name, how big it is, the estimated saving in KB and as a percentage, the size it's displayed at on the page, the size of the file being downloaded and a suggested target size. So you might find an image that's 1117 by 1223 pixels being shown at around 367 by 402 on a phone - which means visitors are downloading far more image than they can see. Where we can, we'll also give you a properly sized version to download.
The "estimated saving" is Lighthouse's best guess at how much data could be saved if that image were the right size or better compressed. It's an estimate, not a promise, but it's a good guide to which images are worth bothering with.
A couple of things to know. We only show images where the saving is more than about 10KB, so you're not buried in tiny fixes, and if the same image gets flagged more than once we combine it into one item. And this is about images on the page we tested - it doesn't mean every other image on your site is fine, or that every image on this page is perfect if it's not listed.
The key performance metrics
These are the cards with the three-letter names. Each one shows the current figure, a simple status like Good or Poor, how it's changed since the last check and a small graph of its history.
LCP - Largest Contentful Paint
In human terms, how long does a visitor wait before the important part of the page looks loaded? Usually that's the main heading, a big image or the first block of text. It's the closest thing to "how fast does this page feel" in one number. (Google's own guidance is that under 2.5 seconds counts as good.)
CLS - Cumulative Layout Shift
This measures how much things jump around while the page loads. You've definitely had this happen - you go to tap a button, an image or advert loads above it, everything shifts down and you tap the wrong thing. It's scored as a number rather than a time, and lower is better (Google counts 0.1 or under as good).
TBT - Total Blocking Time
While a page loads, the browser has a lot of work to do, and while it's busy it can't respond to someone tapping or scrolling. TBT measures how much of that busy time there was. JavaScript (the code that makes pages interactive) is often involved, but not always, so a high TBT is a reason to look rather than a diagnosis.
(The technical bit: TBT is a lab measurement that tends to track Interaction to Next Paint, or INP, which is how quickly a page responds when real visitors interact with it. We record INP too where Lighthouse provides it.)
TTFB - Time to First Byte
This is how long it takes before your website starts sending anything back at all. It's the very first step - nothing else can happen until it's done. A slow TTFB can be down to hosting, but it can just as easily be the website doing a lot of work behind the scenes, a database being slow, caching not being set up, or the network in between. So please don't read a poor TTFB as "my hosting is rubbish" without someone looking into it.
Page weight
This is the total amount of data downloaded to load the page, usually shown in MB. Heavier pages take longer on slower connections and use more of your visitors' mobile data. We also record what that weight is made of - images, scripts, stylesheets, fonts, media and so on - and that breakdown lives in Developer details. Page weight is one of the most useful things to watch over time, because it tends to creep up as new images, plugins and tools get added.
Passing checks
This is a collapsible section with a count, like "7 checks passed". It's there because we're not only looking for problems - these are the checks Lighthouse ran that didn't find anything significant. It's nice to know what's working (and handy if you're trying to show a client or your boss that the site is in decent shape). Which checks appear here depends on what Lighthouse found on that scan.
Developer details
The main report is kept deliberately simple, and the technical evidence goes in an expandable section called Developer details. In there you might find Lighthouse's detailed timings, the specific files or URLs involved, render-blocking files (CSS or JavaScript that may be holding up the page from appearing), third-party scripts (things like analytics, chat tools, embedded videos and ads loaded from other companies' servers), JavaScript timings and any redirects that are adding wasted time (a redirect is an extra hop before the browser gets to the file it needs).
You don't need to understand any of this yourself. It's there so that when you pass an issue on to your developer or agency, they've got the evidence to start investigating rather than having to run all the tests again. And a note on third-party scripts in particular - they're often doing a useful job, so the answer usually isn't "remove them", it's "check they're all still needed and loaded sensibly".
Watch the trend, not the single scan
Running a one-off speed test tells you how a page did at that moment. Because SiteVitals keeps every scan, you can see how things change, and that's where most of the value is.
It's especially worth checking the graphs after:
- changes to your website
- plugin or module updates
- a redesign
- adding a new third-party tool (a chat widget, a booking system, a new tracking script)
- moving hosting
- adding new content or a batch of new images
If the score drops or page weight jumps around one of those, that's a good clue. We won't always be able to tell you exactly what caused a change, but the timing narrows it down a lot (and if you've been logging changes on your timeline, it narrows it down even more).
What the report can and can't tell you
We'd rather be upfront about this so you know how to read it:
- it's a mobile test, so it shows how your page performs on a simulated mid-range phone
- it tests the specific page you're monitoring, not every page on your site - other pages may behave differently
- Lighthouse is an automated lab test, not a measurement of your real visitors, so results vary a bit between scans
- the overall score is a useful summary but doesn't tell the whole story on its own
- a warning tells you where a problem probably is and gives evidence for it, but it can't always tell your developer exactly what work is needed - that depends on how your site is built
- not every recommendation is equally urgent, which is why we prioritise them
The AI Client Estimate
At the bottom of the report, Agency users will also see an AI Client Estimate. This uses the scan results as a starting point for drafting an estimate of the work involved, which you can then review and adapt before sending to a client. Because it’s based on automated scan data, the actual work required will depend on the site’s codebase, setup and hosting, so it should be treated as a useful first draft rather than a final quote.
What to do next
Start with the graph. If your score, LCP and page weight are steady or improving, you're in good shape, even if the number isn't as high as you'd like. Then have a look at What needs attention and Images you can improve now - the images are often the quickest win, especially if we've given you a resized version to download.
For anything more technical, send it to whoever looks after your site, and point them at Developer details. You don't need to become a performance expert - you just need to know enough to ask the right question. And if something on the report doesn't make sense, drop us a line and we'll explain it (and probably add it here too).

By Lisa Freeman · Co-Founder
Industry veteran with 25+ years experience in web development and client experience.
Share this post
Stay in the loop
Get new posts delivered to your inbox. No spam, unsubscribe any time.